Computer Vision Componentry
Optimizing Componentry Analysis of Tephra with Computer Vision
Python in Science Conference (SciPy 2022)
Tyler J. Newton, Joshua Wiejaczka
Abstract
Forecasts of volcanic ash hazards rely on models informed by field studies of analogous eruptions. Two model parameters that affect forecasts, plume height and mass eruption rate, are calculated through componentry analysis, in which the size and type of particles from past eruptions are manually characterized using a stereomicroscope. To optimize this time-consuming process, we developed a computer-vision-based componentry analysis to segment and classify images of volcanic particles and estimate each particle’s shape. We utilize transfer learning on vision models pretrained on ImageNet: a U^2-Net for background removal, and a ResNet for classification of individual particles. Our componentry workflow reduces labor, increases the accuracy of the estimated particle shape, and vastly increases the amount of data that can be processed, enabling more robust dispersion models and accurate hazards forecasts.
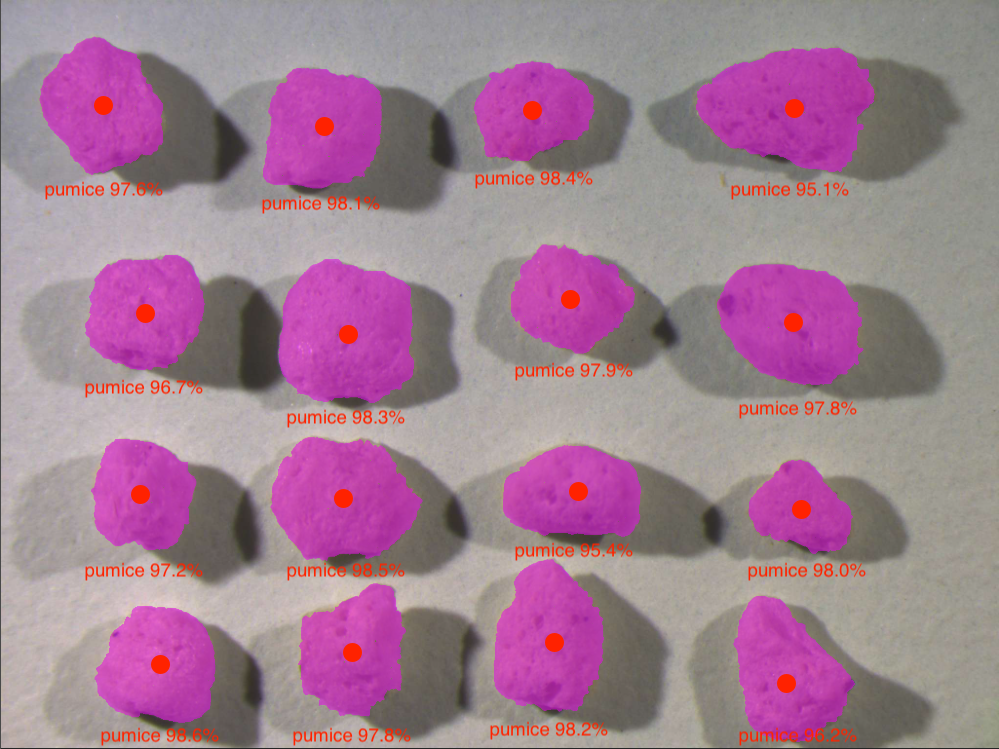
The goal of computer vision componentry is to quantify the shape and properties of each particle in an input image.
Introduction
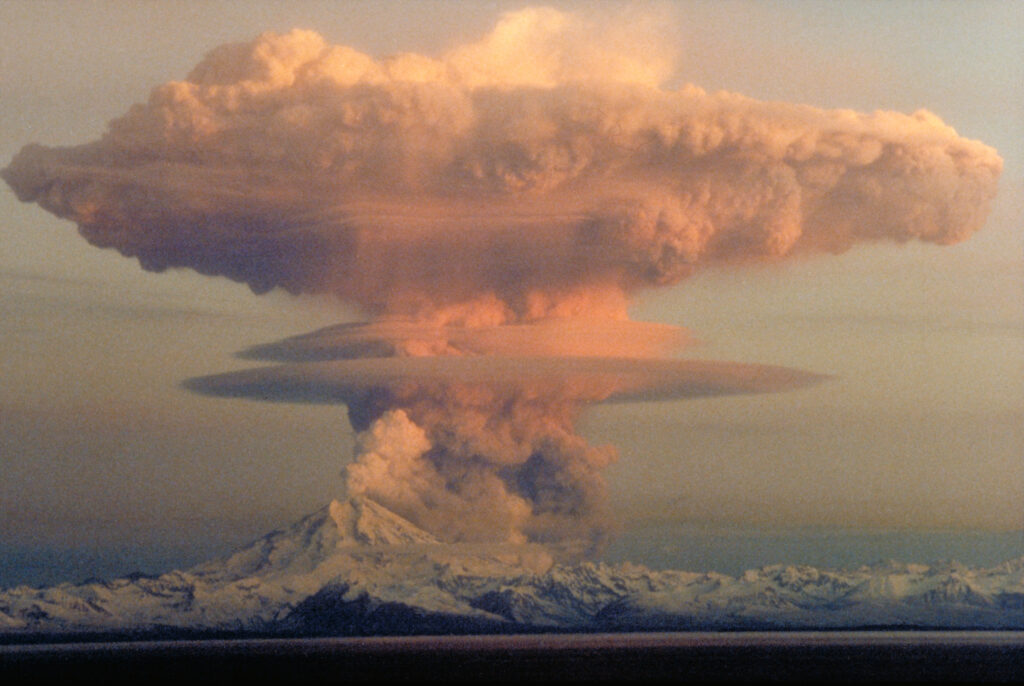
During a volcanic eruption, dispersion models are used to forecast and mitigate impacts to air traffic and communities in the path of an evolving volcanic ash cloud. The accuracy of these forecasts depends on the initial model parameters such as ash cloud height, erupted volume, mass eruption rate, and the total grain-size distribution of particles ejected by a volcano into the atmosphere. These initial model parameters are challenging to constrain in real time, so forecasts rely on information obtained through detailed field studies of analogous historic eruptions. Two of these parameters, ash cloud height and mass eruption rate, are directly calculated through an analysis of the size and type of erupted particles from historic eruptions, termed componentry analysis. The current methodology of determining componentry involves separating individual particles by hand under a stereomicroscope for visual analysis. This process is not only time consuming, but also becomes subjective at smaller particle sizes of less than 1 mm due to human interpretation.
To optimize componentry analysis, we developed a pipeline of computer vision methods to segment, classify, and characterize the size of imaged particles. The particles we imaged and used as a training dataset were collected from a field study of the Cleetwood eruption, and produced during a historic explosive volcanic eruption. The Cleetwood eruption occurred ~7,700 years ago, was Plinian in type (like the Mount St. Helens eruption on May 18, 1980), and occurred at Mount Mazama (Oregon, USA). Mount Mazama is better known for the large caldera that formed during a later eruption, now containing Crater Lake. Plinian eruptions like Cleetwood produce large columns of volcanic debris that extend into the upper stratosphere, so developing a comprehensive understanding of the ejected particles is critical to the accuracy of hazards forecasts.
We analyzed images of tephra, or volcanic particles, from the Cleetwood eruption by first identifying the boundary of all particle instances in a single image utilizing a U^2-Net. Our ongoing research that expands on this work accomplishes instance segmentation utilizing a Swin Transformer that was pretrained on ImageNet and then adapted to our dataset with transfer learning. Next, we cropped and resized each particle instance, then masked out the image background. Subsequently, the masked images were classified as pumice, banded pumice, obsidian pyroclasts, lithics, or crystals utilizing a ResNet-50 deep neural network pretrained on the ImageNet dataset and modified for our dataset with transfer learning. The classification model results were analyzed with various activation maps like GradCAM and SmoothGrad, and dimensional embeddings like t-SNE and PCA. Finally, we exploited the boundary of each particle recovered from instance segmentation to quantify four shape parameters of each particle: solidity, convexity, axial ratio, and circularity.
Our computer vision componentry pipeline is adaptable to image datasets that require segmentation and classification of objects and estimation of their shapes, including images of tephra and geological samples that complement our segmentation and classification models trained on tephra from the Cleetwood eruption. We present a computer vision componentry analysis that reduces labor, increases accuracy of the estimated object shape, and increases the amount of data that can be ingested compared to manual componentry analysis, enabling more robust dispersion models and accurate hazards forecasts.
Data, Methods, and Results
Instance Segmentation
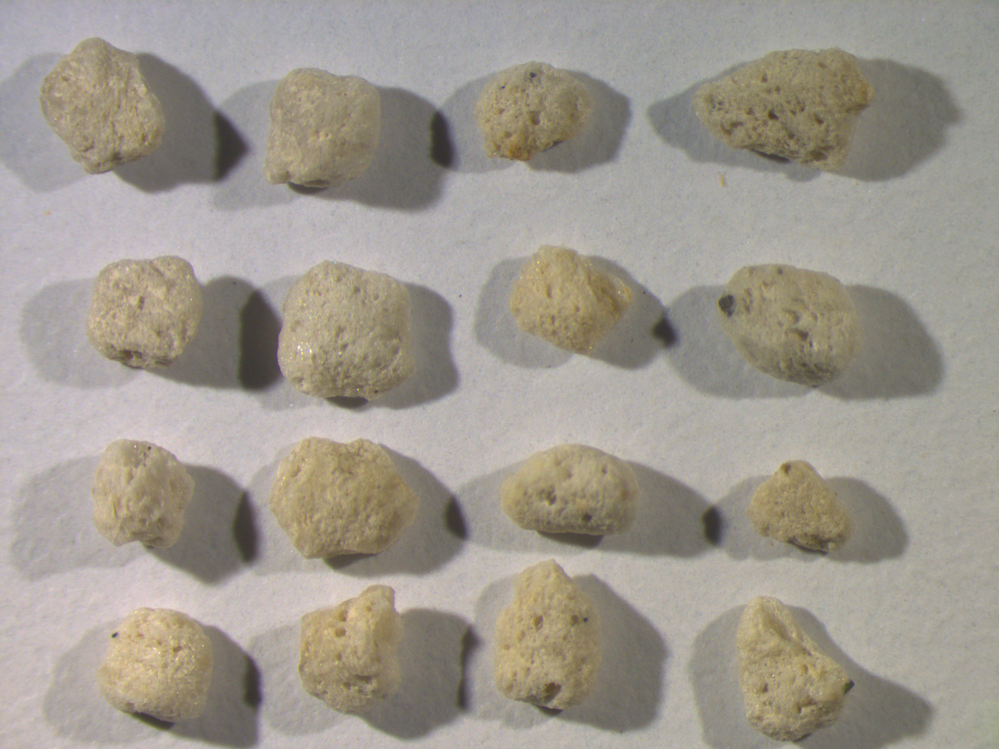
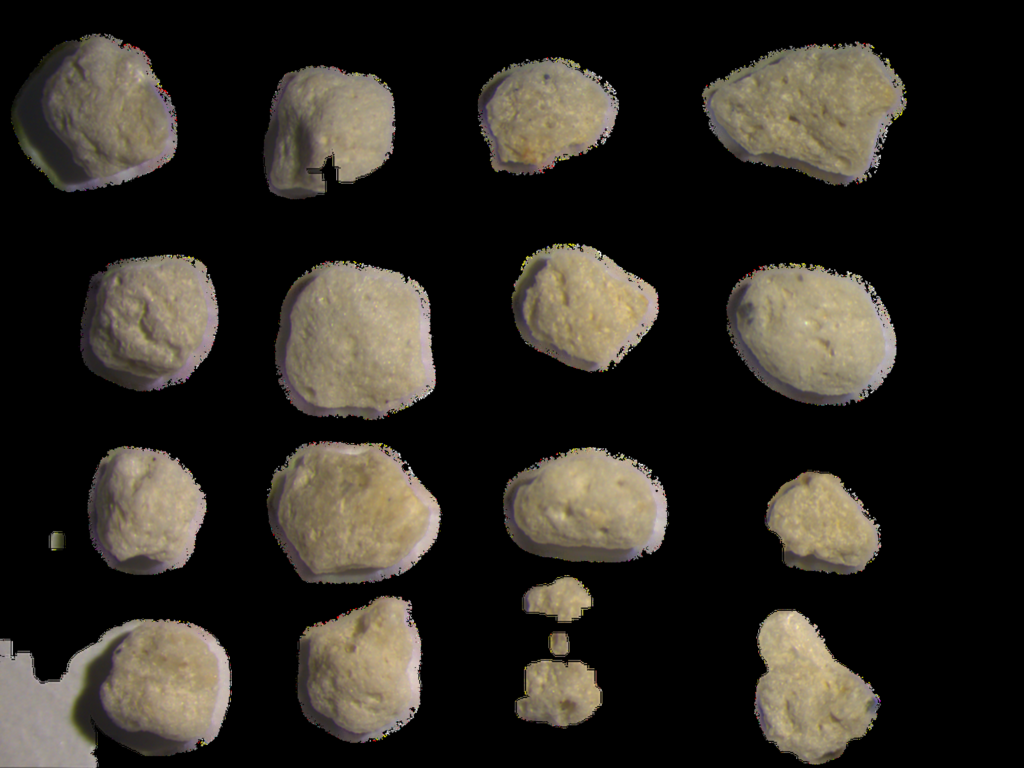
In order to test the ability of a pretrained U^2-Net to detect the boundaries of volcanic particles, we collected and annotated a dataset designed for this task. Our instance segmentation training data consists of images captured through a stereomicroscope, each containing 1-36 tephra of varying sizes placed on background materials of different colors and textures. We varied lighting conditions, microscope focus, and field of view to increase data diversification. We find that the pretrained U^2-Net performs well when tuned for images containing only a single particle. We did not find a single set of parameters to robustly detect each particle in images containing many particles. In our ongoing work, we generated particle instance annotations to train a Swin Transformer V2 for more robust instance segmentation.
Classification
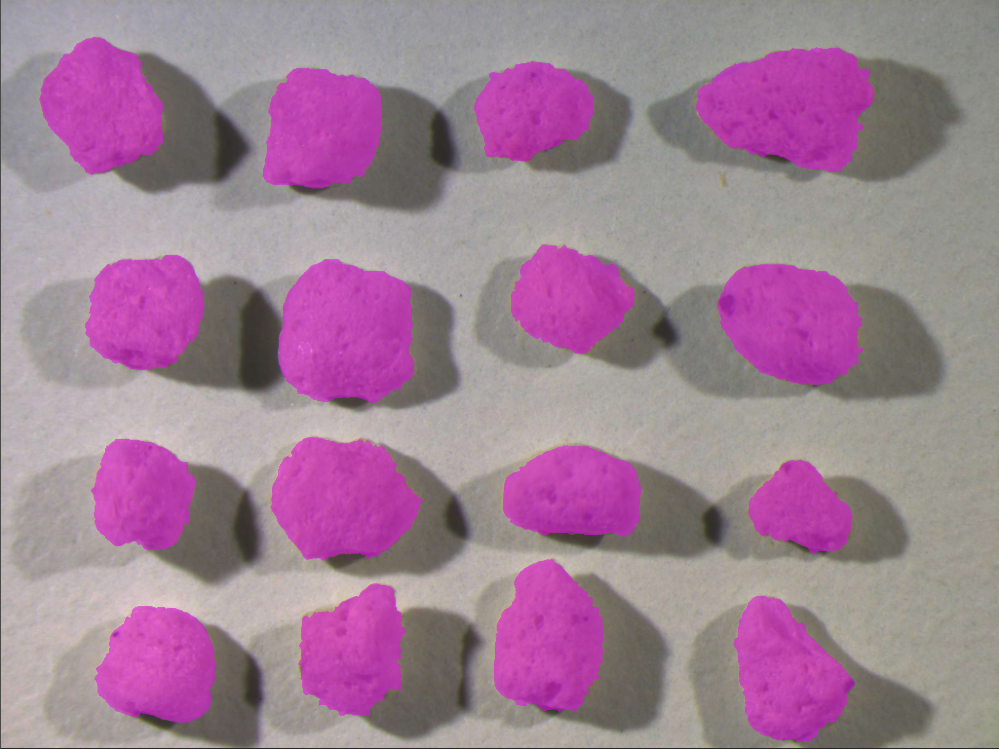
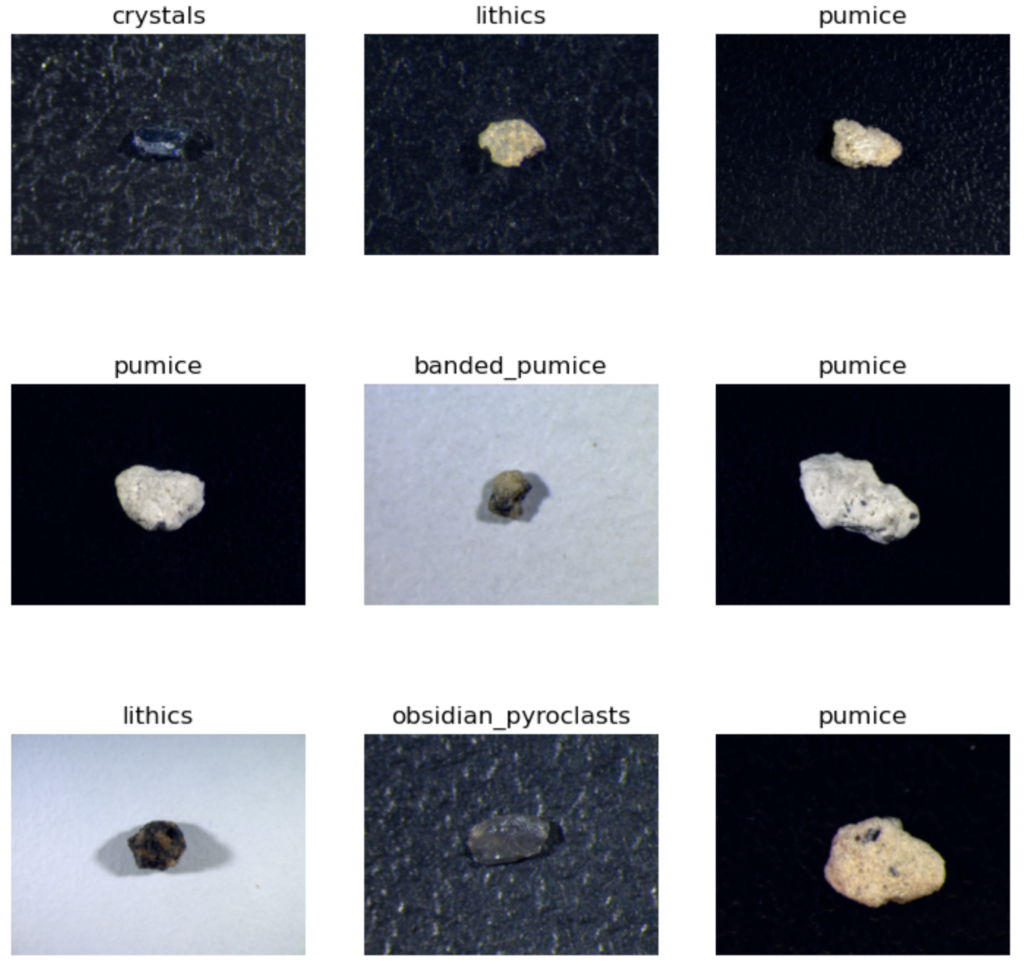
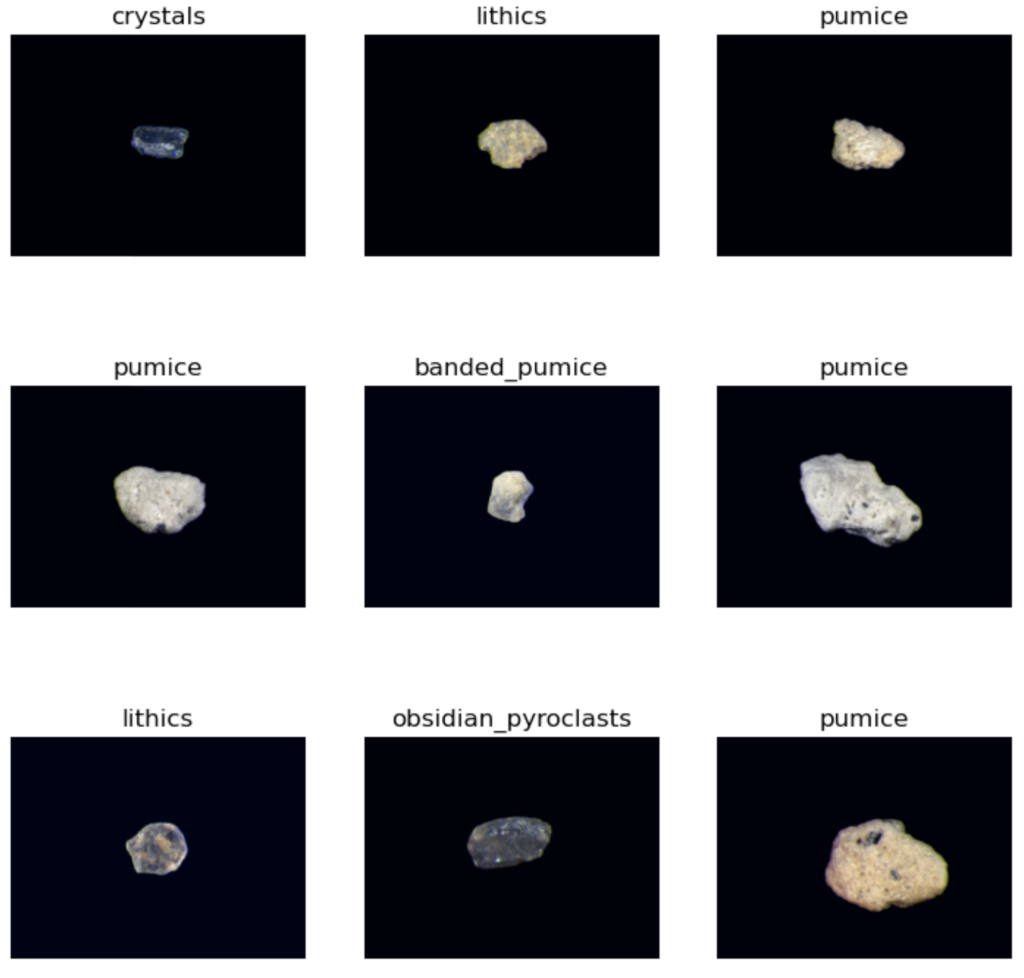
Our classification training data consist of cropped images derived from instance segmentation. The images each contain single tephra. The size of individual particles ranges from 0.25 mm to 4.0 mm. Each image was labeled as one of five classes: pumice, banded pumice, lithics, obsidian pyroclasts, or crystals. Each class represents a different type of volcanic rock with distinct features, such as banding or grain size, that are distinguishable by a human expert. Following classification data labeling, we removed the image backgrounds from the classification training data to test the classification model accuracy on images with and without background clutter. We utilized the tephra boundaries recovered by our instance segmentation model to isolate each volcanic particle from the background clutter in the classification training data.
We utilized transfer learning on a ResNet-50 model pretrained on ImageNet to classify images with the background in place and images with the background removed. The output layer of the ResNet50 model is adapted for the five classes present in the dataset. The 50-layer ResNet model contains 23,518,277 trainable parameters. 80% of the classification dataset was utilized for training, 20% of the dataset was used for testing, and 20% of the training data was used for validation. Additionally, images were randomly horizontally flipped before training.
We used a learning rate optimizer over 100 iterations with the Adam optimizer and cross-entropy loss with a starting learning rate of 1 x 10⁻⁷ to find the optimal learning rate for training. Based on the steepest descent in the learning rate curve, a learning rate of 1 x 10^-3 was used during training. Further, we used a learning rate scheduler with discriminative fine-tuning to improve the training performance. The resulting classification model outputs the predicted class of the individual particle in the input image.
Attention Mapping
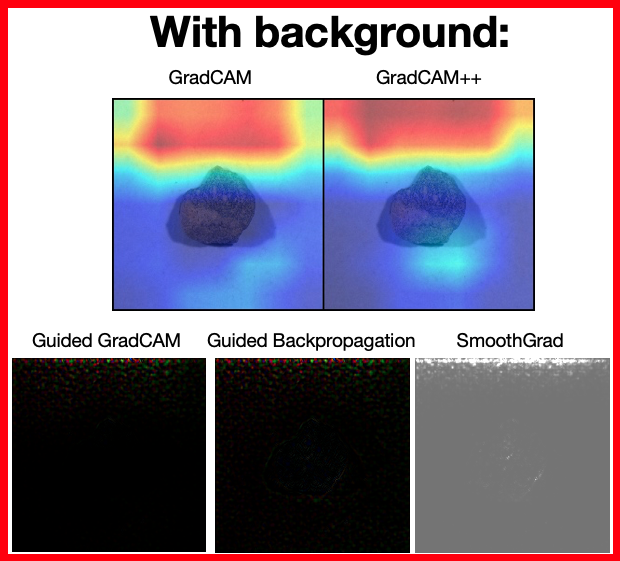
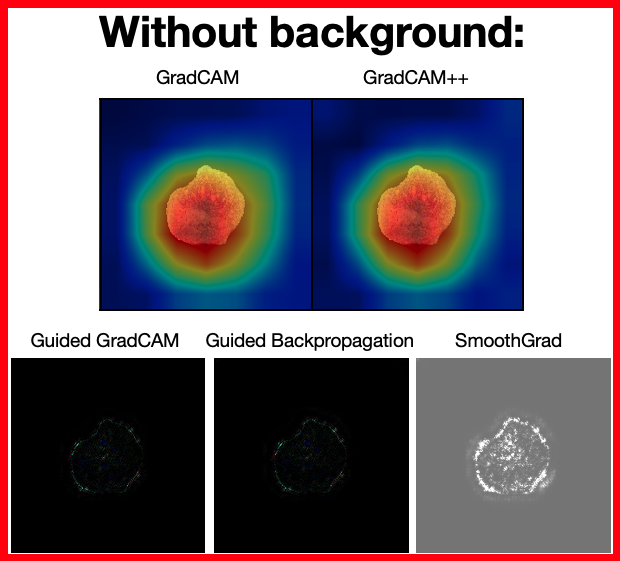
We implemented five methods of attention mapping to highlight regions of tephra that are important to the ResNet-50 classification model when mapping from the input image to the predicted class. Coarse-grained attention maps were generated using GradCAM and GradCAM++ from an open-source PyTorch implementation. Additionally, fine-grained attention maps were generated using guided GradCAM, guided backpropagation, and SmoothGrad from a different open-source PyTorch implementation.
The attention maps serve to distinguish how well the model is learning important features of the volcanic samples and compare these features with those a human expert would use to classify the same samples. Attention mapping also serves as a tool to identify differences between the features considered by the classification model for images with and without background subtraction.
The attention maps generated from GadCAM, GradCAM++, guided GradCAM, guided backpropagation, and SmoothGrad for the image with background in-place all show that the classification model is predominantly considering the image background when misclassifying this sample as an obsidian pyroclast. In contrast, the attention maps generated from the five methods for the image with the background removed show that the classification model is considering features of the sample, like its texture and shape, rather than features of the background.
Shape Characterization
We characterize the shape of tephra from boundaries recovered by instance segmentation into four shape parameters: solidity, convexity, axial ratio, and circularity. Shape parameters represent non-dimensional ratios that are measures of a particle’s physical properties. These four parameters were selected because they effectively quantify the morphological variance in most ash samples. Different shape parameters are sensitive to distinct aspects of a particle’s form and roughness. Solidity quantifies the distribution of a particle’s area in space to characterize morphological roughness. Convexity characterizes textural roughness along a particle’s edges, and axial ratio characterizes the overall form of a particle by comparing two particle dimensions. Finally, circularity characterizes the deviation of a particle from a circle to characterize its overall shape.
Conclusions
We developed multiple computational pipelines for computer vision componentry analysis. Our pipelines distinguish tephra and their boundaries from background clutter. Following the detection of each particle boundary, tephra are classified by type and the particle shape is quantified with four shape parameters. Stay tuned for the paper and updated instance segmentation model. Our future work will unify the segmentation and classification vision tasks with a state-of-the-art vision transformer backbone.